Revenue for those same 10 imported Filipino products was up 13.3% since 2013 and rose 1.2% from 2014.
America has a population of 321.4 million people and is the world’s second-richest country based on purchasing power parity, a methodology that considers living costs and inflation.
Overall, America bought $10.6 billion worth of imported goods from the Philippines during 2015. That amount represents a 14.2% gain from $9.3 billion for Filipino imports to America in 2013.
America’s Top 10 Imports from the Philippines
Top 10
Below are the top 10 import products shipped from the Philippines to America during 2015. Shown within parenthesis is the percentage change in sales over the three-year period starting in 2013.
- Integrated circuits/microassemblies: US$1.3 billion (down -5.2% since 2013)
- Insulated wire/cable: $692.1 million (up 48%)
- Computers, optical readers: $652.9 million (up 12.1%)
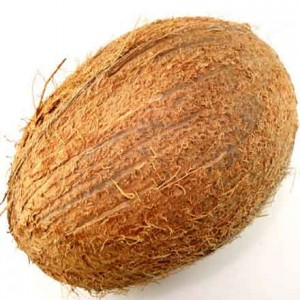
- Coconut/palm oil: $547.4 million (up 19.9%)
- Computer parts, accessories: $502.4 million (down -22%)
- Electrical converters/power units: $468.4 million (up 3.2%)
- Cases, handbags, wallets: $282.2 million (up 153.3%)
- TV receivers/monitors/projectors: $272.2 million (up 77%)
- Solar power diodes/semi-conductors: $260.8 million (up 0.1%)
- Printing machinery: $235.2 million (up 123.4%)
The above items support US industrial appetites for electronics components as well as food products notably coconut and palm oil. Imported Filipino cases, handbags and wallets remain in demand by American consumers.
Integrated electronic circuits and microassemblies are the Filipino products most in demand by US importers. Philippines placed tenth among the world’s biggest suppliers of integrated circuits and microassemblies, trailing seven other Asian countries, Germany and ironically–the United States.
Gainers/Decliners
Among America’s Top 10 imports from the Philippines, cases, handbags and wallets increased in value the most up by 153.3% since 2013.
Also appreciating were printing machinery (up 123.4%), television equipment (up 77%) and insulated wire and cable (up 48%).
Only two top 10 Filipino imports into the US dropped in value. Computer parts and accessories were down -22% while deliveries in integrated circuits and microassemblies depreciated by -5.2%.
Resources
World’s richest countries ranked, Rankings based on purchasing power parity. Accessed on February 15, 2016
The World Factbook, Field Listing: Exports – Commodities, Central Intelligence Agency. Accessed on February 15, 2016
Trade Map, International Trade Centre. Accessed on February 15, 2016